.svg)
Why do most software and platform providers find out about a broken integration from a customer instead of from their own systems?
Truthfully, most integration tools are designed strictly to move data, rather than communicate their status. Workflows typically succeed or fail silently behind the scenes, and teams rarely have a proactive safety net in place to immediately notify them the second a new problem actually arises.
That gap is costly. Workflows fail quietly, and quiet failures are the expensive kind. They erode customer trust and pull engineers off product work to chase down a problem better visibility should have caught hours earlier.
So, what actually closes that gap? The root issue is rarely the connection itself. It is the lack of visibility around it.
Whether teams build their own integration platform or rely on basic no-code integration platform for simple workflows, they usually spot these monitoring gaps only after a frustrated customer complains about a broken data sync.
A properly built workflow automation platform treats monitoring as a core feature, not something layered on after the third outage.
For teams weighing a heavier iPaaS alternative against something built for embedding, or evaluating a dedicated SaaS integration hub to centralize every customer connection, it comes down to one question: can you see a failure before your customer does?
Why Integration Failures Remain Invisible Until They Breach SLAs
Most integration stacks are built to move data, not to explain themselves.
A sync job either completes or it does not. In a lot of platforms, that is the entire feedback loop.
This blind spot compounds because integration failures rarely announce themselves loudly. A few examples show how quietly things go wrong:
- An API call times out and retries silently in the background.
- A field mapping breaks after a customer's ERP admin renames a custom field.
- A token expires overnight while nobody is watching the log.
By the time a support ticket surfaces the issue, the damage has usually already spread.
Downstream reports are wrong. The SLA breach clock started counting the moment the failure occurred, not the moment someone noticed it.
Traditional application logs were never designed to answer these questions well.
They capture events, not context. A raw log file rarely tells you which customer is affected, how long an issue has been running, or what business process just quietly stopped. Providers relying on a bare bones data integration platform with no purpose-built monitoring layer are, in effect, choosing to find out about failures from their customers first.
The Four Dominant Failure Modes in Modern Integration Workflows
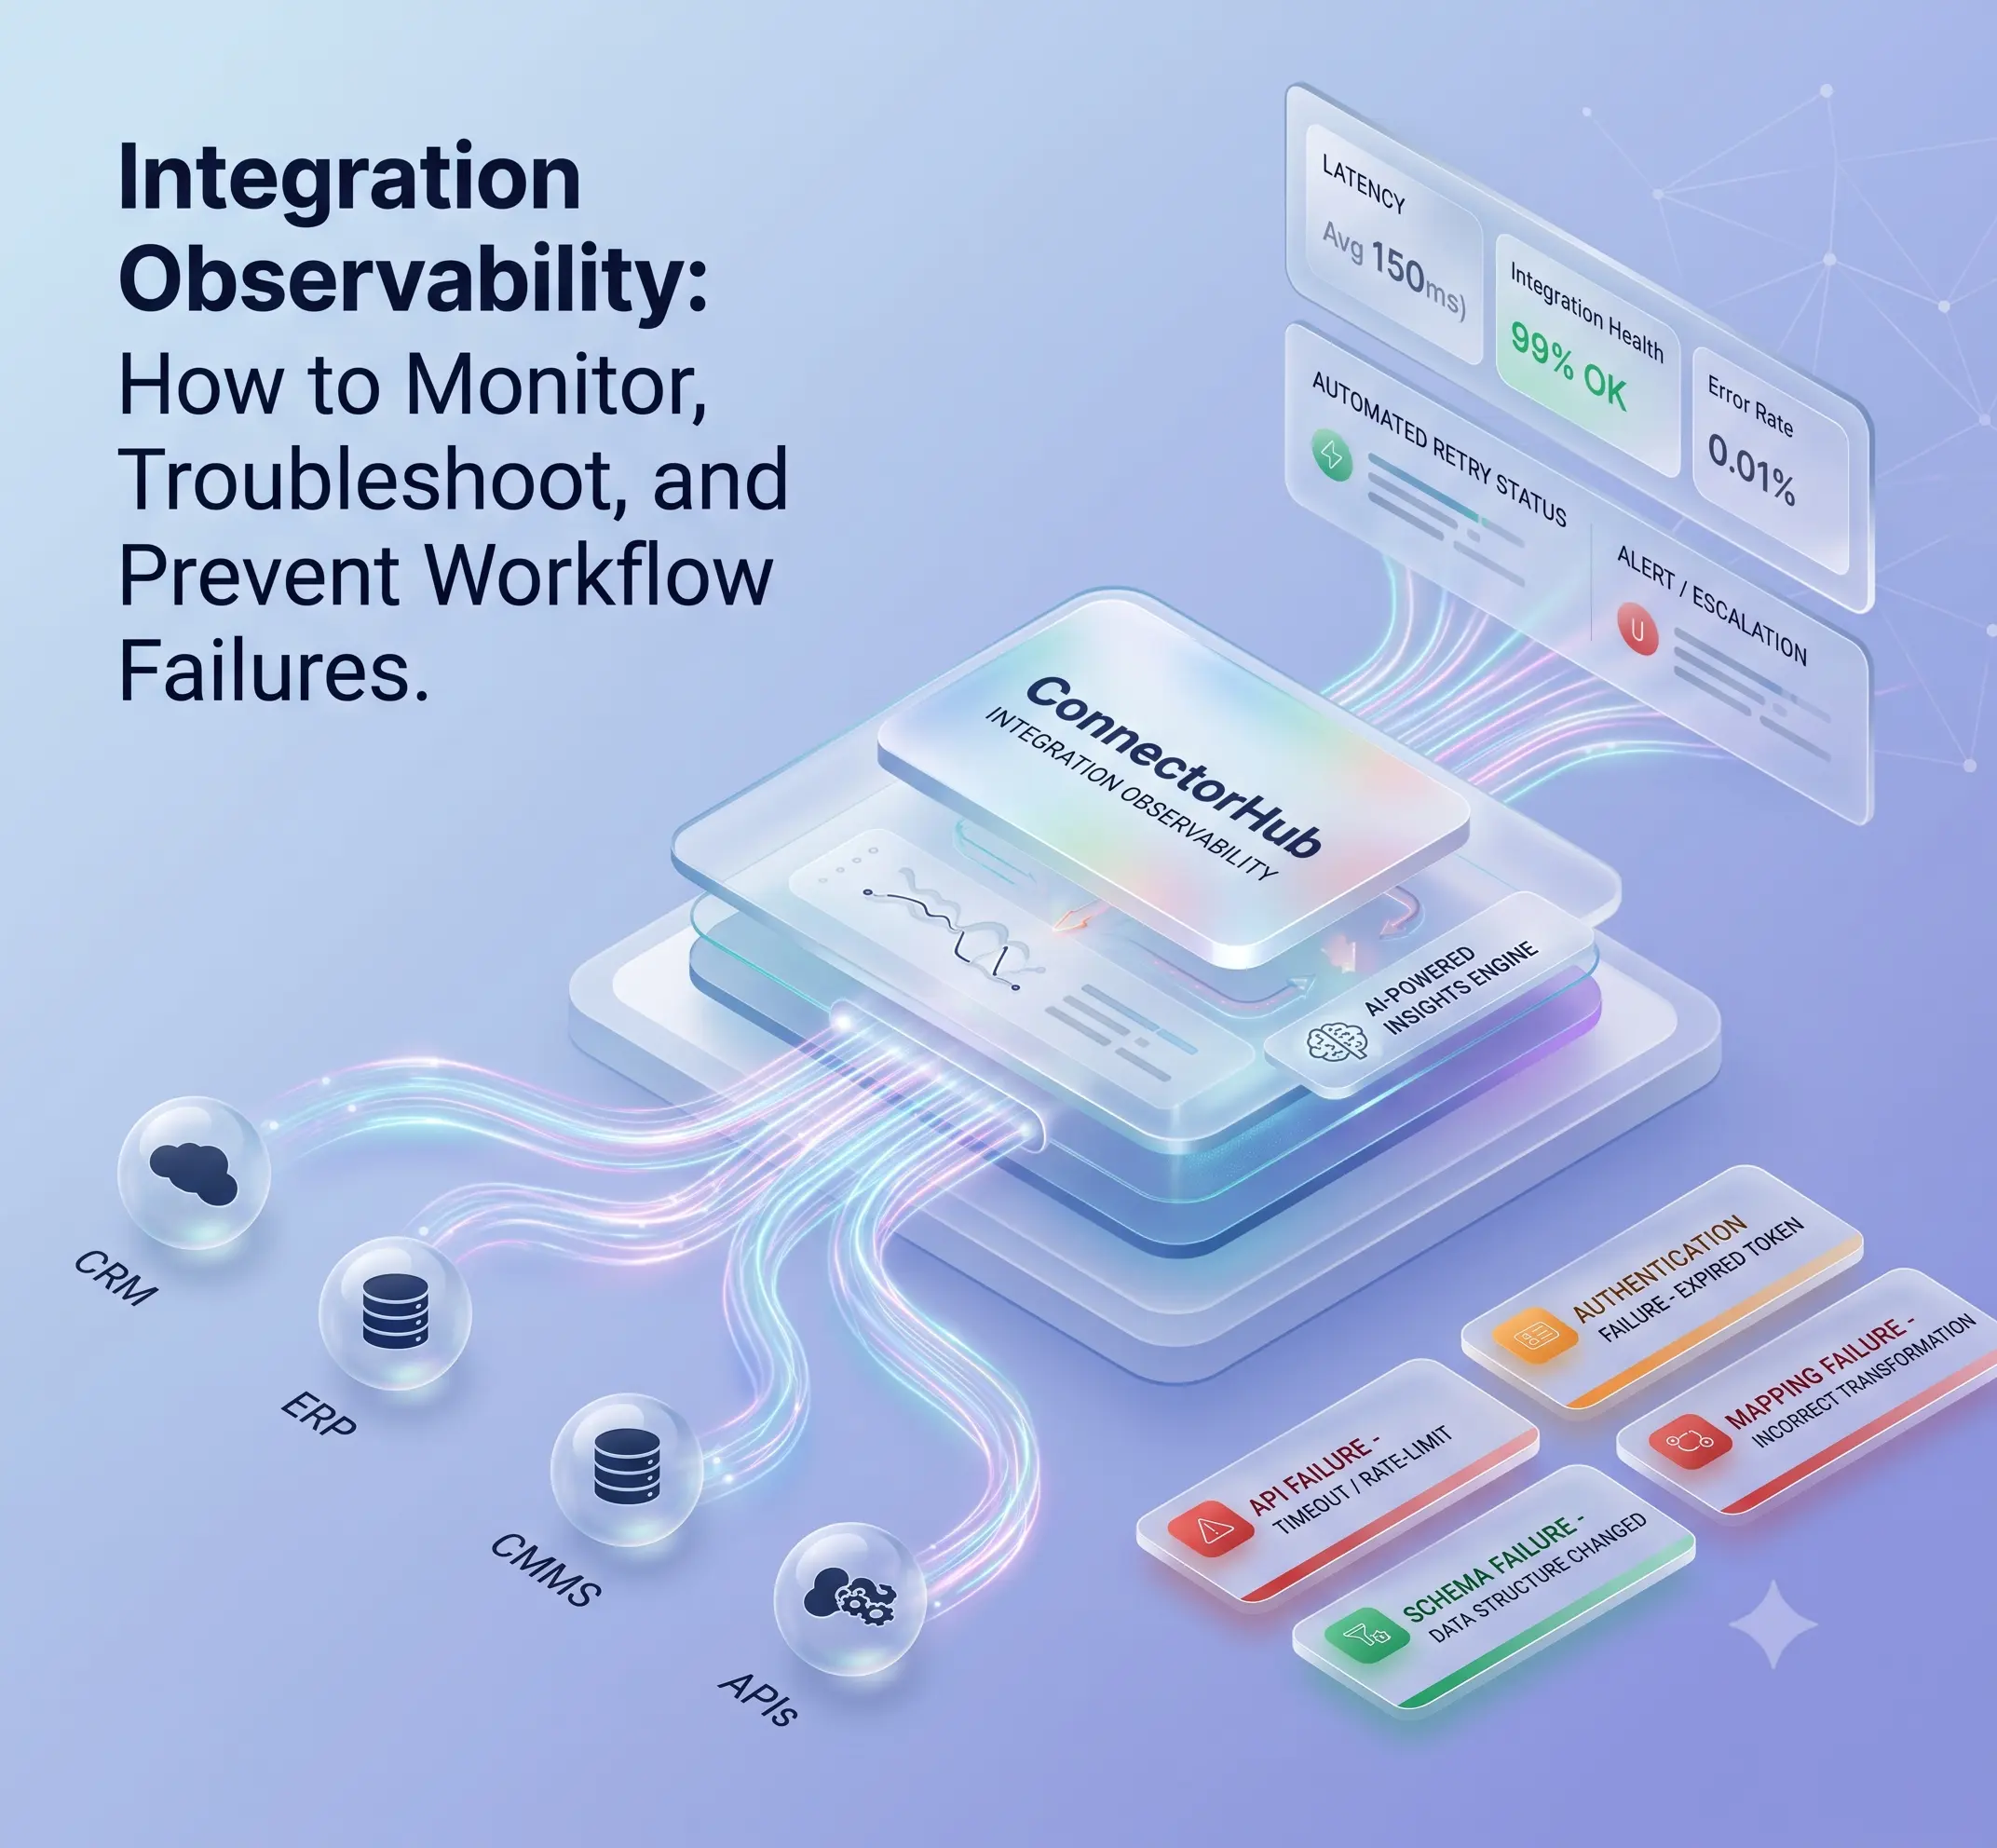
Across thousands of production workflows, teams consistently find themselves battling the same four failure categories.
Naming them makes them far easier to watch for and far faster to resolve.
API failures happen when the endpoint times out, rate limits the request or returns an unexpected response code during the integration process with the customer’s ERP, CRM, or CMMS.
They usually are intermittent, making them easy to ignore until they cluster around a particular customer or period. Authentication failures occur when a token expiring, credential rotation, or customer revoking API access without notifying anyone.
A workflow that ran perfectly for months can go dark overnight because of a single expired secret.
Schema failures show up when a source or destination system changes its data structure.
A customer adds a required field to their CRM integration setup, renames a property, or changes a data type. The workflow that expected the old structure quietly starts rejecting records.
Mapping failures are the most subtle of the four. The connection works and the schema matches, but the logic translating a value from one system's format into another's produces incorrect output.
Nothing breaks. The workflow just delivers wrong data with total confidence.
From Reactive Logging to Full Integration Observability
Logging tells you what happened after the fact. Integration observability is different.
It provides a continuous, systematic view of every run, every transformation, and every dependency in the interrelated systems, such that a problem is detected within minutes as opposed to days.
The difference lies in the fact that integrations become a crucial element of the customer experience.
After the provider has embedded their product within the customer's ERP, CRM, or cloud integration platform, the whole pipeline then becomes their product responsibility regardless of whether it was their code that caused the problem.
Full observability means three things working together:
- All workflows are logged with sufficient metadata to determine who, what, and when, without having to dig into the details manually.
- All failures are categorized according to type and not just registering an error message.
- The system identifies trends and not just single events, allowing the team to recognize a failing integration before it becomes completely dysfunctional.
Reactive teams treat monitoring as a debugging tool they reach for after a complaint.
Observability-minded teams treat it as an early warning system running continuously in the background, whether anyone is actively watching or not.
Monitoring, Troubleshooting, and Preventing Workflow Failures
These three activities get discussed as one thing, but they solve different problems and need different tooling.
Workflow monitoring is the continuous layer that answers whether things are running as expected right now. It tracks run status, latency, volume, and error rate across every active connection, updating in near real time rather than on a daily batch cycle.
Troubleshooting happens after monitoring flags something.
It is the investigative work of tracing a failed run back through its transformation steps to find exactly where and why it broke, ideally by jumping straight to the failed record instead of reading an entire log line by line.
Prevention is the process which completes the circle.
Each incident must go back into the system as a new rule of validation, a new threshold of alerts, or a new criterion for mapping, so the same category of failures does not happen again unnoticed.
Effective workflow exception management uses each failure as one piece of information for the next thousand runs, rather than as a stand-alone event to be closed.
The three stages complete the cycle – detection through monitoring, diagnosis through troubleshooting, and resolution through prevention.
Designing Dashboards That Surface API, Auth, Schema, and Mapping Issues Early
A dashboard becomes effective only if it provides answers quicker than looking at the log file.
Most integration monitoring dashboards lack this ability since they have been created to visualize data, not to prioritize it.
A dashboard built to catch the four failure modes above needs a few specific elements:
- Status by failure type, not just a generic success or failure count, so a spike in schema errors stands out clearly from a spike in rate limiting.
- Customer-level breakdowns, since a healthy aggregate number can hide one customer's integration quietly falling apart.
- Indicators in SLA countdowns that demonstrate how much runway is left until a delayed workflow exceeds a committed threshold.
- Latency and error rate historical trend lines, so slow degradation can be seen before there’s an outage.
The good dashboards filter signal from noise intentionally.
It is not fair to have the same visual representation of a workflow that retries once and succeeds as of one that fails three times in a row, or people will end up having a dashboard that everyone ignores in time.
Automated Retries, Intelligent Alerts, and Escalation Paths That Contain Impact
Not every failure needs a human.
Error handling automation should absorb the routine, recoverable issues on its own, so people only get pulled in when their judgment adds real value.
A sensible retry policy accounts for the type of failure. A rate-limited API call benefits from an exponential backoff and a quiet retry. An expired auth token does not. Retrying against a dead credential just wastes cycles and delays the moment someone notices. The system needs to know the difference.
Alerting works the same way.
A single failed run inside an otherwise healthy workflow rarely needs a page overnight. Three consecutive failures, or a pattern tied to a customer nearing an SLA deadline, absolutely does.
Alert thresholds tuned to business impact keep teams responsive without burning them out on noise.
Escalation paths close the gap between detection and resolution. A well-designed path might look like this:
- An unresolved auth failure routes to whoever owns customer credentials.
- A schema break routes to whoever manages that connector.
- An SLA breach routes straight to a manager who can reach out to the customer first.
Root-Cause Analysis Techniques That Convert Incidents into Permanent Safeguards
Fixing an incident and understanding it are not the same accomplishment, though it is tempting to treat them as one once the alert clears.
A useful root-cause review answers three questions for every meaningful incident:
- What was the immediate trigger?
- What upstream condition let that trigger cause a failure instead of getting caught earlier?
- What specific change prevents the same failure class going forward?
The discipline worth building is treating recurring failure patterns as signals about systemic gaps, not bad luck.
If auth failures keep surfacing from the same customer's system, the fix might be a proactive token refresh cycle rather than another one-off patch.
If schema breaks keep clustering around a specific connector, that connector likely needs stricter validation at the mapping layer.
Documenting these findings matters as much as fixing the immediate problem.
A shared record of past incidents becomes institutional memory, so the next engineer on call is not solving the same mystery from scratch.
How ConnectorHub Embeds Observability into Integration Workflows for Platform Providers
This is exactly the gap ConnectorHub was built to close for software and platform companies.
It lets them offer integrations without absorbing the cost of building integration performance monitoring from the ground up.
The platform with a live dashboard for monitoring the SLA health, execution status, and anomaly detection for all workflows.
This is powered by machine learning models that detect any unusual behavior before it becomes an incident reported to customers.
For providers trying to compare dedicated iPaas solutions against building one in-house, this visibility saves several months of engineering efforts.
What sets ConnectorHub apart for software and platform providers specifically is its dedicated partner program.
It gives partners a licensable integration layer, complete with a white-label SDK and UI embed options, so monitoring and observability appear as a native part of the partner's own product rather than a separate, ConnectorHub-branded tool.
Partners also get:
- Role-based tenant isolation for managing multiple customers securely.
- SOC 2, HIPAA, and GDPR-aligned compliance built in from day one.
- Embedded usage analytics as a standard part of every license tier.
Most partners launch a branded enterprise integration platform experience for their customers in three to four weeks, without building a monitoring stack of their own.
Also Read: 7 Integration Trends Reshaping How Modern Operations Think About Data Flow
Conclusion
Integration failures do not have to stay invisible until a customer feels them.
The difference between a platform that reacts to outages and one that prevents them comes down to whether failures are visible in minutes or discovered in days.
A few principles worth carrying forward:
- API, auth, schema, and mapping failures each need distinct detection logic, not a single generic error log.
- Dashboards should prioritize by failure type and SLA risk, not just raw event counts.
- Automated retry mechanisms and alert tiers ensure that attention is only paid to those issues which truly require human intervention.
- The root cause analysis must provide a permanent solution and not just close out a ticket.
Developing this kind of functionality internally is certainly possible, though it does take time away from product development.
By integrating a monitoring layer that was designed for exactly this kind of task, a team can deliver trusted integrations without making every engineer an on-call integration detective.